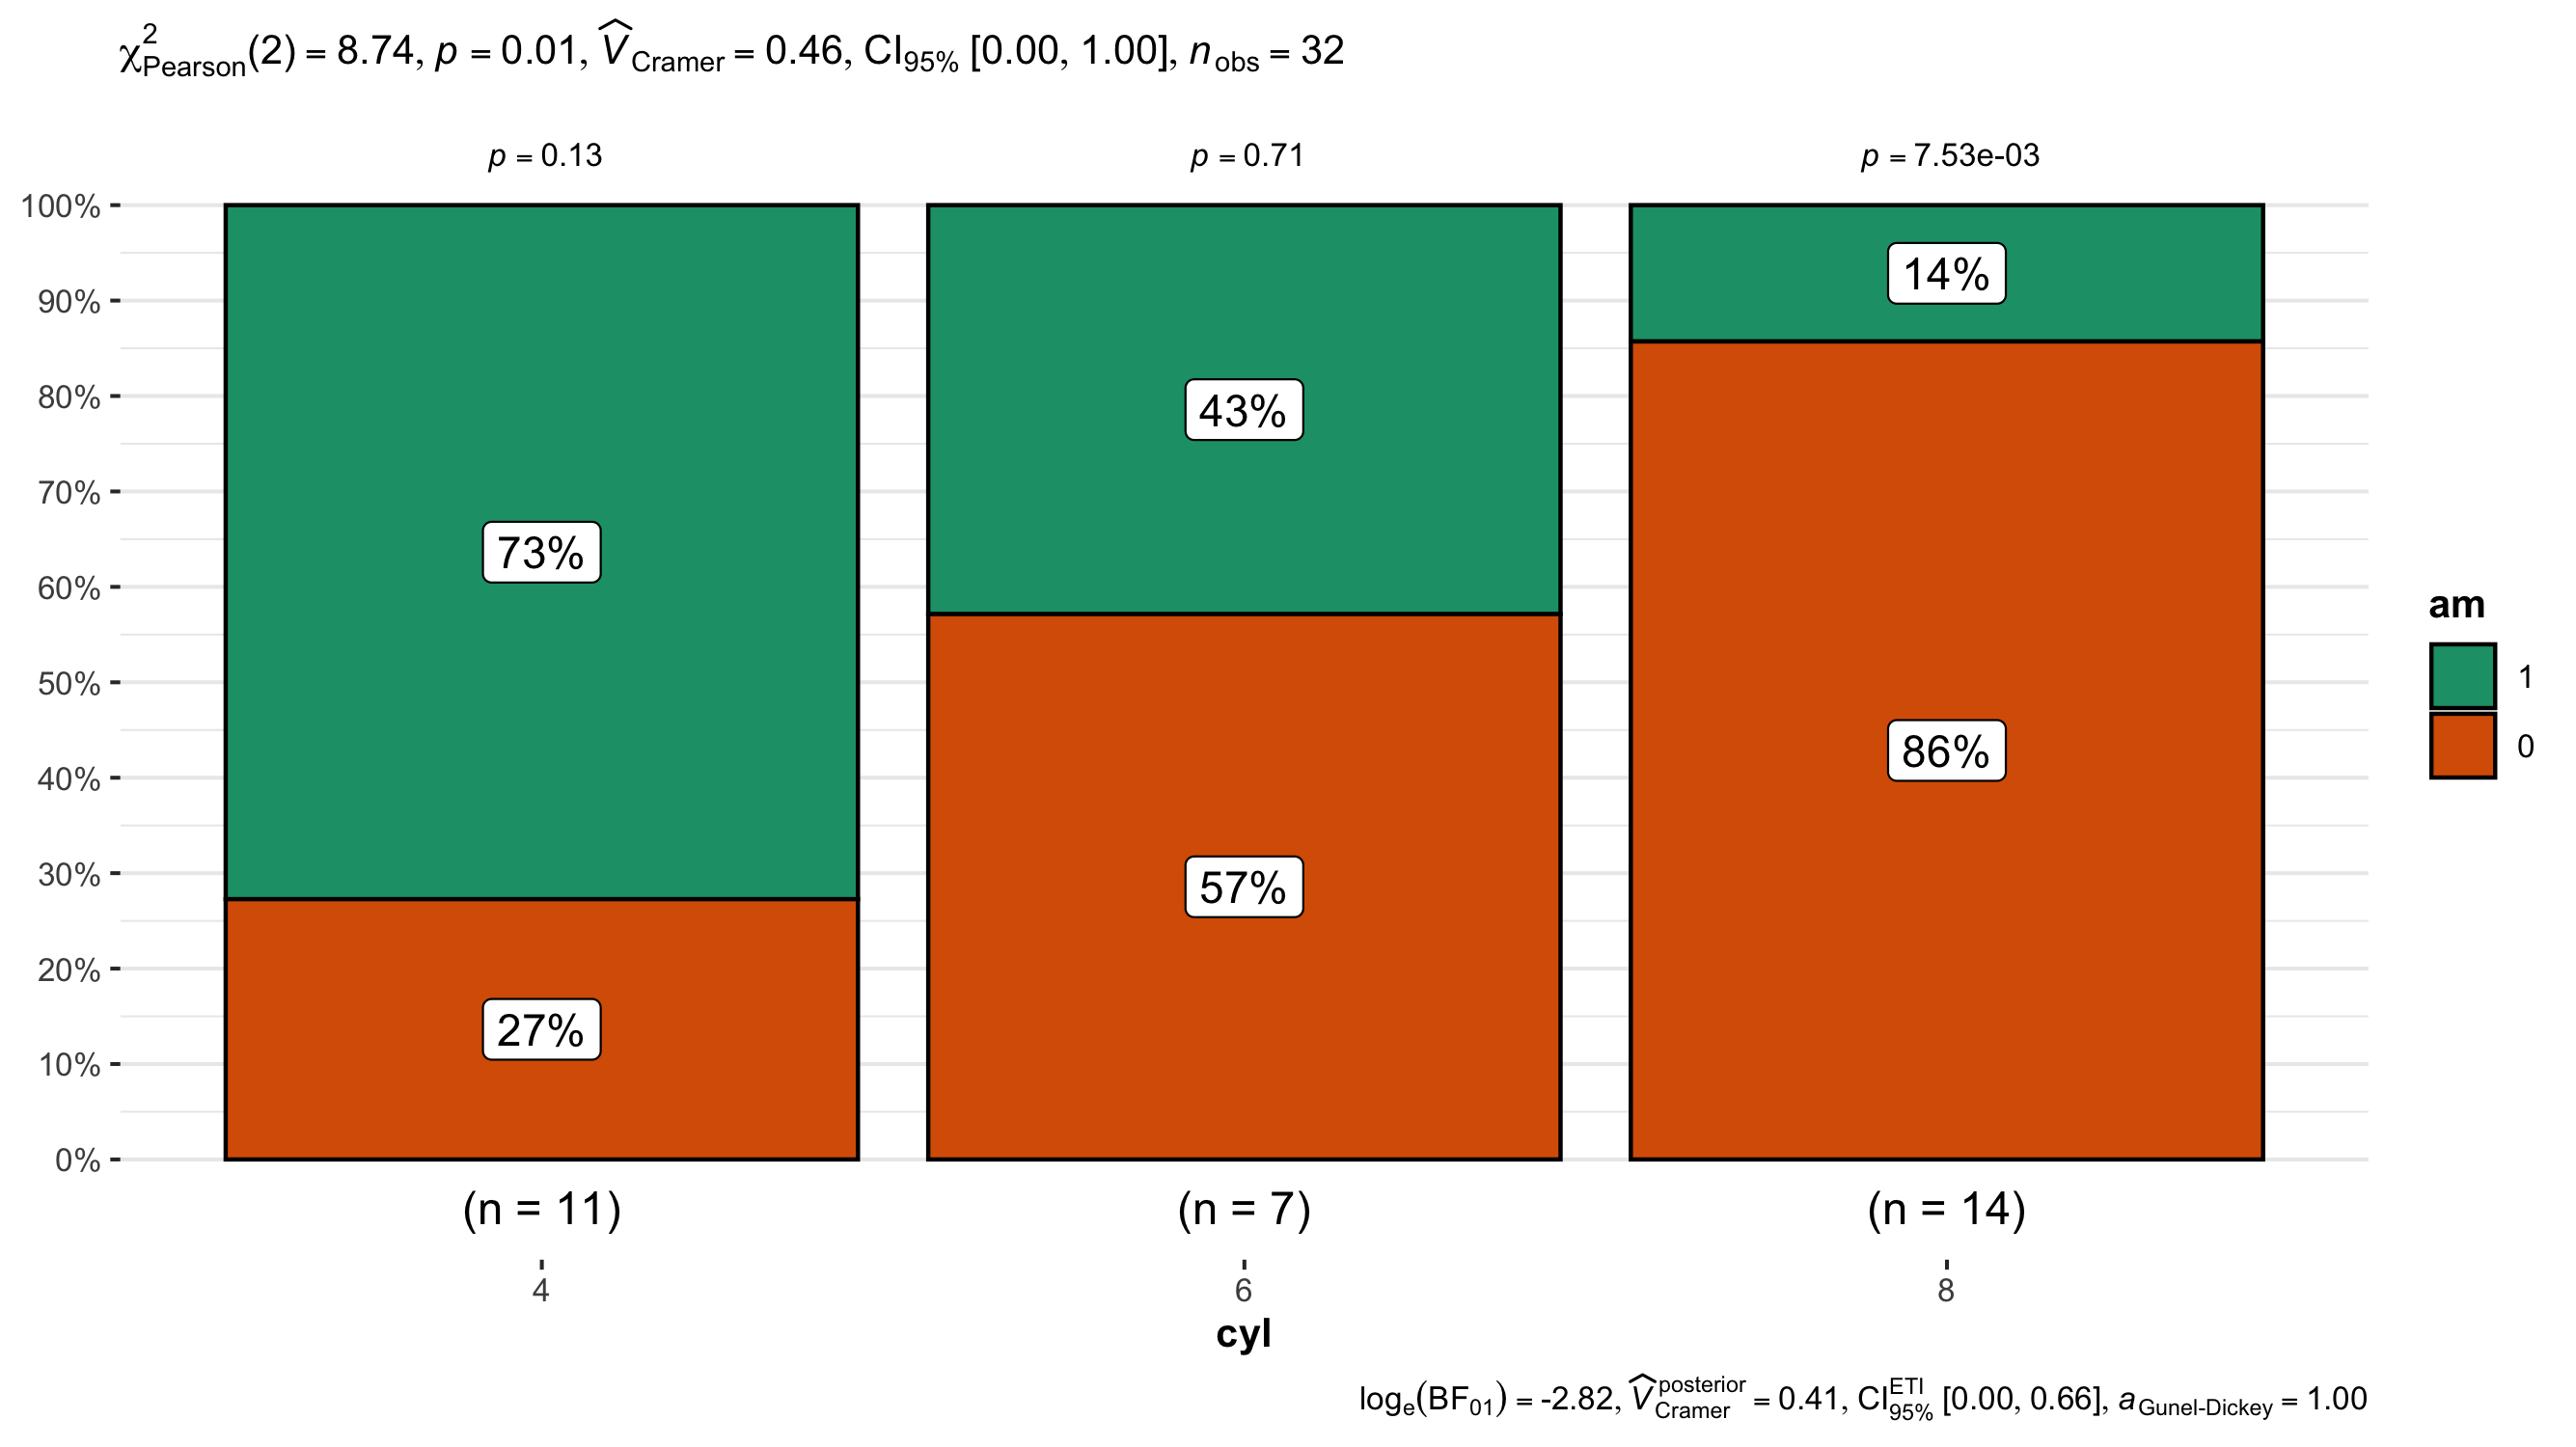
Chi-square
The chi-square test can either test for the independence between two groups or test if a sample is consistent with a known/expected distribution. This test is extremely useful for analyzing differences in categorical data and can help determine if the observed results are in line with expected results, and to rule out that observations are due to chance. The data must be random, independent and drawn from a large(ish) pool (n > 10).
Chi-square test for independence
For this version of the chi-square test, the count data between two groups is compared to see if the counts are independent of each other based on their categorical assignment. For example, if you wanted to determine if taking calculus helped students achieve “A”s in physics the sample would be students in a physics class and the categories would be “A in physics (Y/N)” and “Taken calculus (Y/N)”. The frequencies between the groups could then be compared.
The null hypothesis for the chi-square test for independence is that the samples are independent.
The the alternative hypothesis for the chi-square test for independence is that the samples are NOT independent.
Chi-square test for Goodness-of-fit
For this version of the chi-square test, the count data for one group is compared against known/expected count data based on their categorical assignment. For example, if you wanted to test if a coin is fair, you would flip a coin 100 times and record H/T. The frequencies of H/T for your tosses could then be compared to the expected frequencies of 50/50.
The null hypothesis for the chi-square test for Goodness-of-fit is that the sample data matches the expected distribution.
The the alternative hypothesis for the chi-square test for independence is that the sample does NOT match the expected distribution.
Values needed to conduct a chi-square test
To conduct a chi-square test you will need arrange your count data in a 2 x 2 (or a 2 x n) matrix where the cells in the matrix contain the count data for a specific catagory.
Chi-square test for independence:
| A in physics | Not A in physics | |
|---|---|---|
| Yes calculus | 85 | 15 |
| No calculus | 60 | 40 |
Chi-square test for Goodness-of-fit:
| Heads | Tails | |
|---|---|---|
| Observed | 55 | 45 |
| Expected | 50 | 50 |
Values returned from a chi-square test
Chi-square test for independence:
- degrees of freedom: (sample size - 1) the number of values that have the freedom to vary in the dataset.
- P-value: indicates if the variables have a statistically significant association.
- P-value < 0.05 indicates the variables have a statistically significant association (Reject the null hypothesis).
- P-value > 0.05 indicates that you cannot conclude that the variables are associated (Fail to reject the null hypothesis).
Chi-square test for Goodness-of-fit:
- degrees of freedom: (sample size - 1) the number of values that have the freedom to vary in the dataset.
- P-value: indicates if the variables have a statistically significant association.
- P-value < 0.05 indicates the samples data does not match the expected distribution (Reject the null hypothesis).
- P-value > 0.05 indicates that you cannot conclude that not your sample does not match the expected distribution (Fail to reject the null hypothesis).
Visualizing the results
Just because you ran the analysis in JMP does not mean you have to use JMP to visualize your results. As long as you have a statistically significant result you can generate the plots however you would like (e.g., Excel, Google Sheets, R, Python). All you need to do is add an annotation to the figure that the P-value was < 0.05. A good way to visualize the results of a chi-square test would be to a paired or grouped bar chart. These types of bar charts can clearly display the variation in counts vary between the relevant categories of interest.
