Repeated measures ANOVA
Before you proceed, please familiarize yourself with the ANOVA
A repeated measures ANOVA (analysis of variance) is a statistical test used to analyze the differences between two or more related groups that are measured at multiple time points or under different conditions. In other words, it is a way to compare the means of multiple groups, where the same group of subjects or samples is measured repeatedly.
This type of ANOVA is used when the same individuals or samples are tested under different experimental conditions, such as before and after an intervention, or under different levels of a treatment or exposure.
The null hypothesis for a repeated measures ANOVA is that there is no significant difference in the means of the groups at different time points or under different conditions.
The alternative hypothesis is that there is a significant difference in the means of the groups at different time points or under different conditions.
Example of when and how to use repeated measures ANOVA
For example, imagine a study where researchers want to compare the effectiveness of three different exercise programs on weight loss. They recruit 5 individuals who are overweight and measure their weight before and after they complete each of the three exercise programs. In this case, each participant serves as their own control, as their weight is measured multiple times under different exercise conditions.
| Participant ID | Exercise Program | Weight Before (lbs) | Weight After (lbs) | Weight Difference (lbs) |
|---|---|---|---|---|
| 1 | Program A | 190 | 185 | 5 |
| 1 | Program B | 185 | 180 | 5 |
| 1 | Program C | 180 | 175 | 5 |
| 2 | Program A | 200 | 194 | 6 |
| 2 | Program B | 194 | 190 | 4 |
| 2 | Program C | 190 | 187 | 3 |
| 3 | Program A | 180 | 175 | 5 |
| 3 | Program B | 175 | 170 | 5 |
| 3 | Program C | 170 | 167 | 3 |
| 4 | Program A | 210 | 205 | 5 |
| 4 | Program B | 205 | 200 | 5 |
| 4 | Program C | 200 | 195 | 5 |
| 5 | Program A | 195 | 190 | 5 |
| 5 | Program B | 190 | 185 | 5 |
| 5 | Program C | 185 | 180 | 5 |
To perform a repeated measures ANOVA, the researcher would first calculate the mean weight for each participant at each time point (before and after each exercise program). Then, they would compare the mean weight across the three exercise programs using a repeated measures ANOVA.
Post hoc test
Following the recovery of a statistically significant p-value from a repeated measures ANOVA, a Tukey test should be performed to determine which of the groups are statistically different from each other. The Tukey test does multiple pairwise comparisons between the means of each group. This will tell you which groups within the dataset contain statistically different means.
Visualizing the results
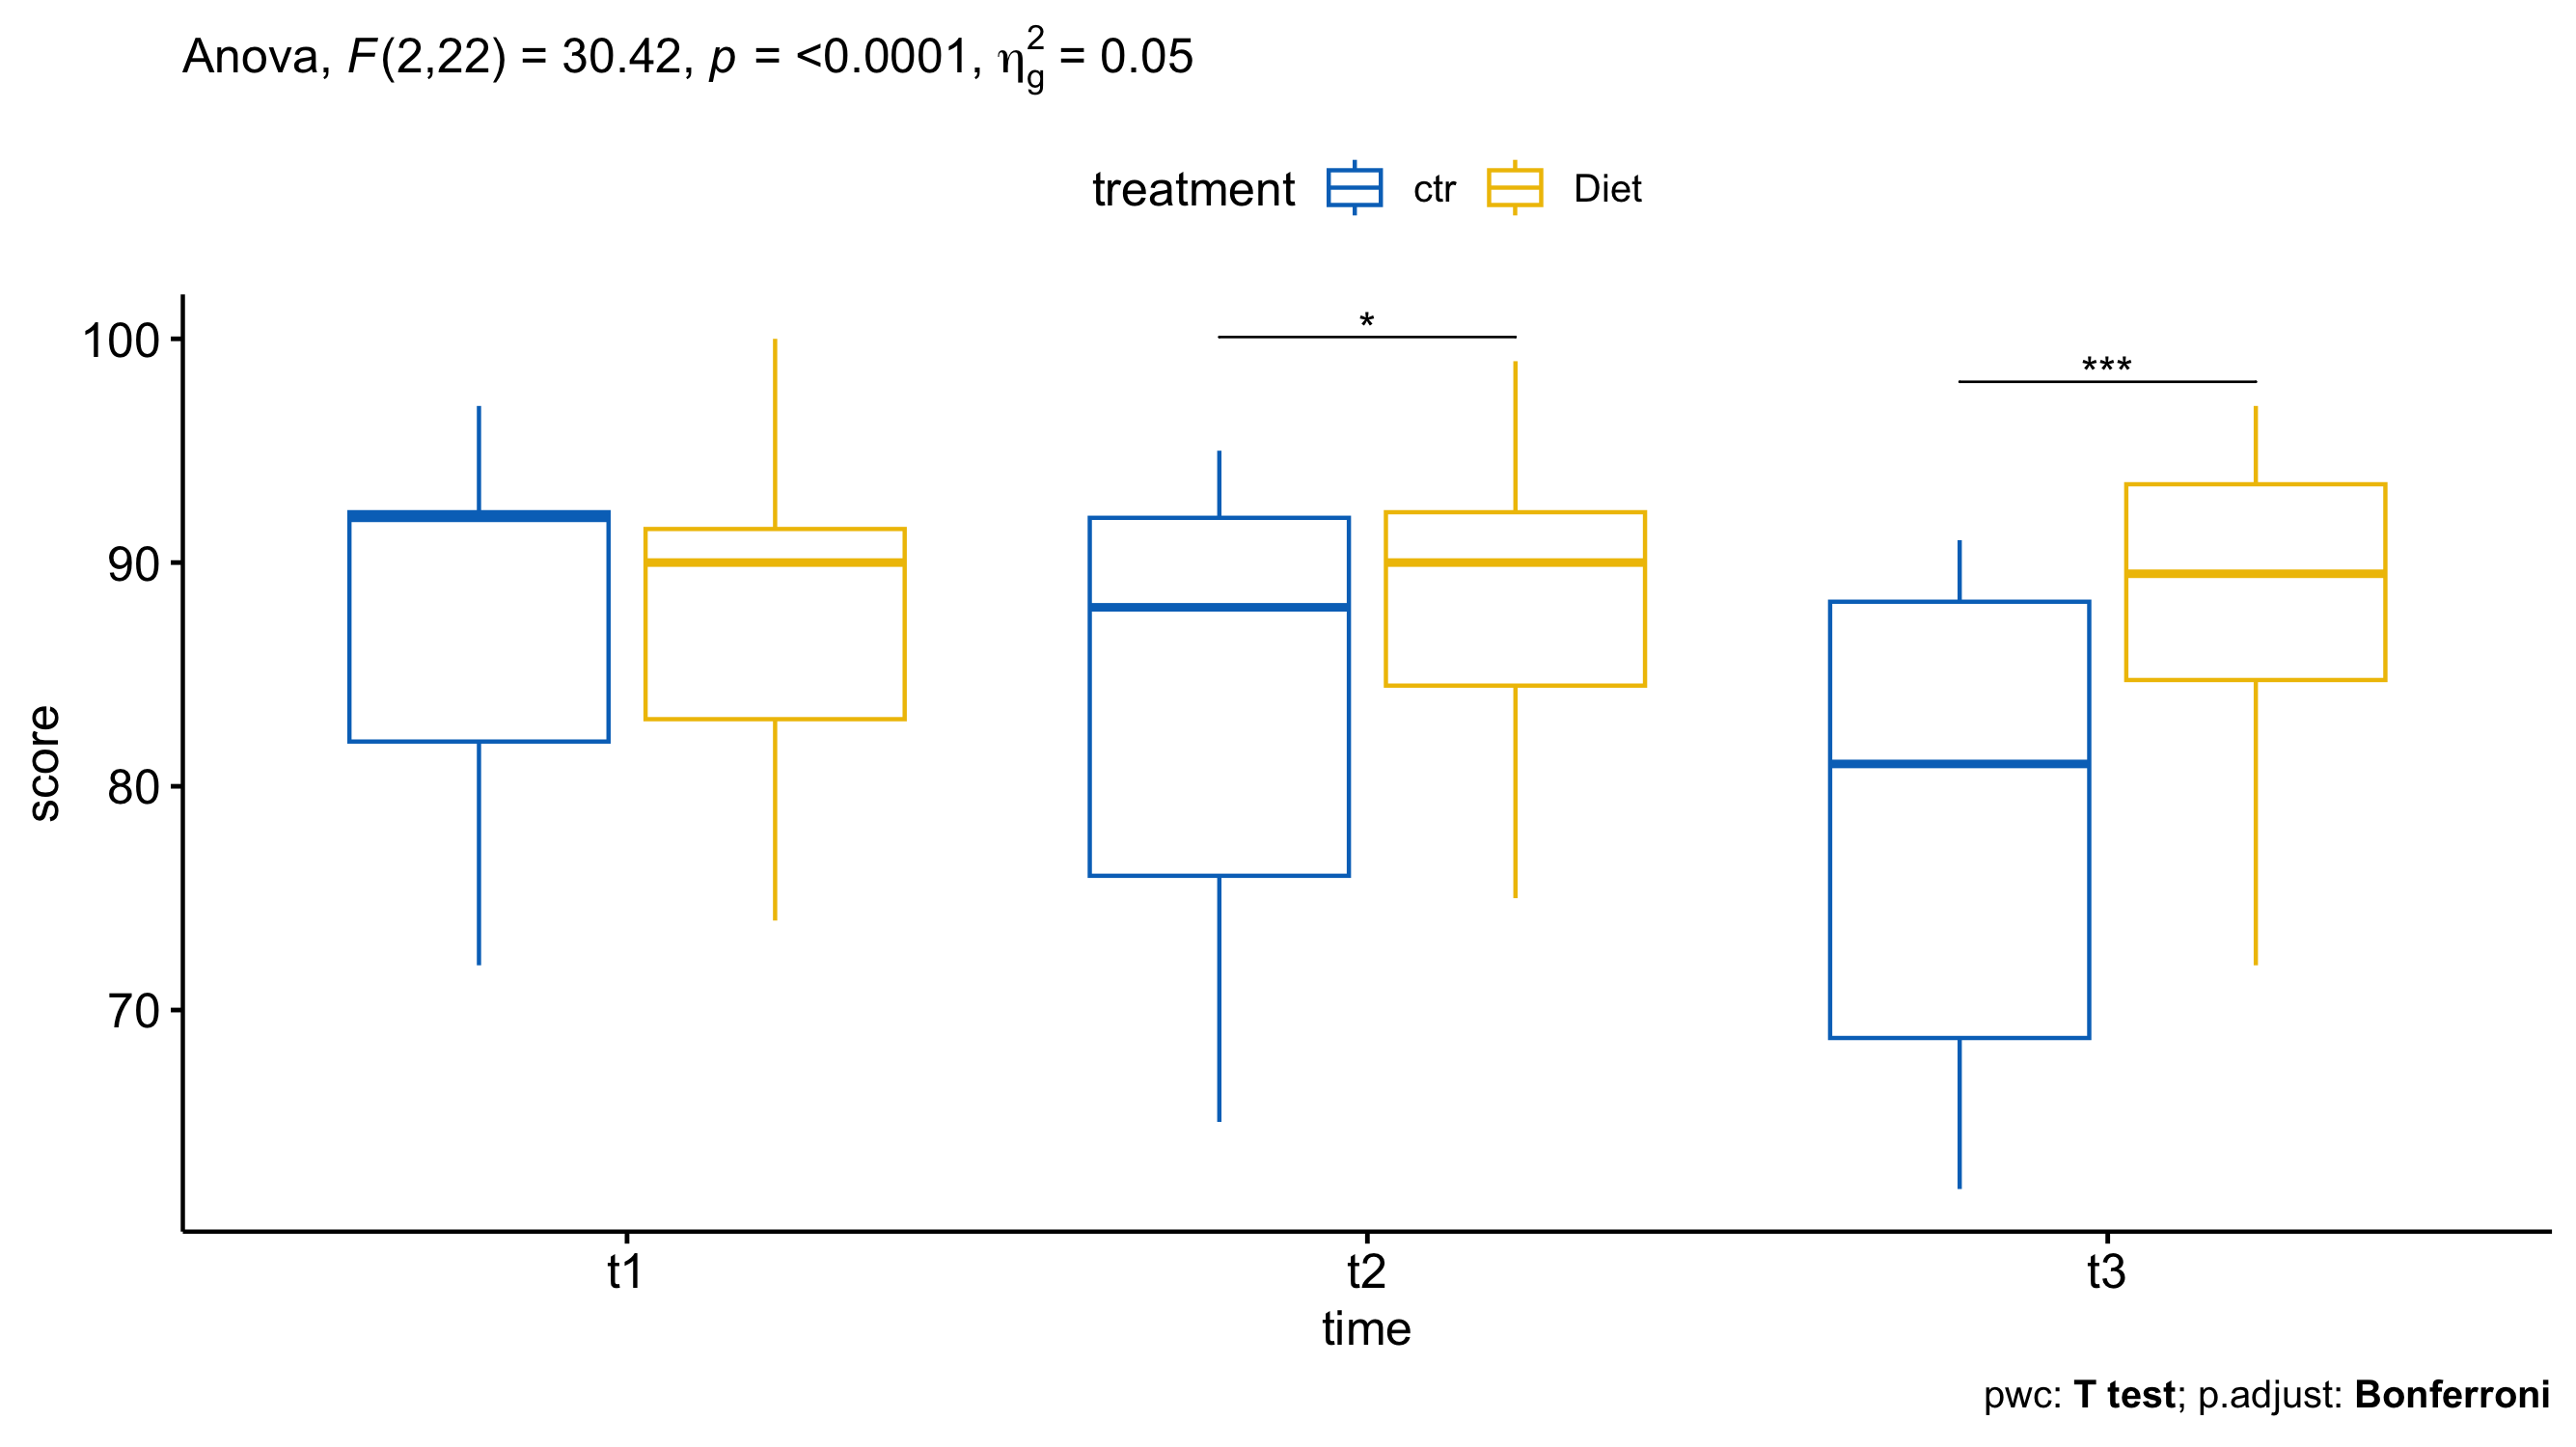
Just because you ran the analysis in JMP does not mean you have to use JMP to visualize your results. As long as you have a statistically significant result you can generate the plots however you would like (e.g., Excel, Google Sheets, R, Python). All you need to do is add an annotation to the figure that specify which groups have a p-value was < 0.05. A box-and-whisker plot would be a good way of visualizing the results of a repeated measures ANOVA. The box-and-whisker plot would present both the spread of the data while also incorporating error bars/confidence intervals.
